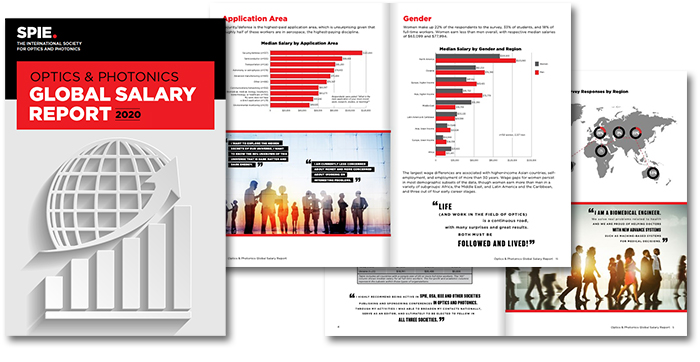
Optics & Photonics Global Salary Report 2020

Salaries in optics and photonics are complicated—the community is active on every continent and engaged in disciplines ranging from aerospace to semiconductors to biotechnology. The Optics and Photonics Global Salary Report helps to make sense of this complex arena by providing an analysis of wages across countries, organization types, career stages, gender, and other categories.
Sign into your SPIE account or create a free new account to learn how your pay compares to your colleagues’, how earnings in academia compare to industry, how gender impacts wages, and more. The report offers 14 topical chapters, more than 20 figures and tables, and the option to download a 21-page PDF.
|
The optics and photonics community is composed of workers and students on every continent, engaged in disciplines ranging from aerospace to semiconductors to biotechnology. The Optics and Photonics Global Salary Report provides a reference for employees, students, and managers interested in understanding compensation across the career landscape: How does my pay compare with that of my colleagues? What is a typical mid-career salary in my country? What can I expect to earn in industry versus academia? The Report addresses these questions and a variety of other topics across fourteen topical chapters, drawing on original research conducted by SPIE.
SPIE delivers the report each year, free of charge, as part of its mission as a not-for-profit educational society supporting the science and application of light. The report builds on data from over 5,000 individuals in 100 countries1 who shared career information in a short online survey. This is the tenth annual survey and report, the largest such study in the optics and photonics community.
Unless otherwise noted, all results are based on full-time workers. For a complete list of participant countries and other details on survey methodology, please see Methodology and Endnotes.
Key Findings
| • | The median salary for full-time employees is $75,000, up $1,000 from last year2. This increase likely reflects the strength of the global economy, and tight labor markets for the highly-skilled workers in our community. |
| • | Salaries paid in Chinese yuan are up 33% versus last year, and have increased an impressive 122% since 2011. Earnings in Japanese yen rose 13%, euro salaries rose 10%, and pay in US dollars was up 4%. Salaries paid in British pounds declined by 2%. |
| • | The highest-paid discipline is aerospace, with a median income of $130,000. Aerospace has held the top spot for all ten years that the survey has been conducted. |
| • | Median salaries are 21% higher overall for men than for women, down from 29% in last year's survey. Women out-earn men in early career stages and several geographic regions. |
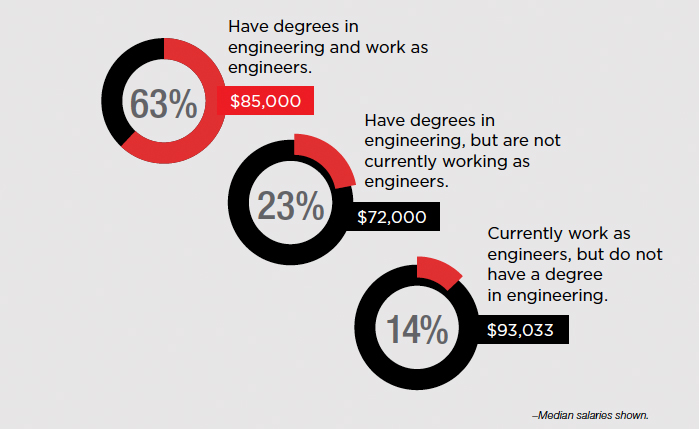
| • | Most full-time workers (65%) identify as engineers. Within this group, 63% have engineering degrees and are working as engineers, 23% have engineering degrees but are not working as engineers, and 14% work as engineers without having engineering degrees. |
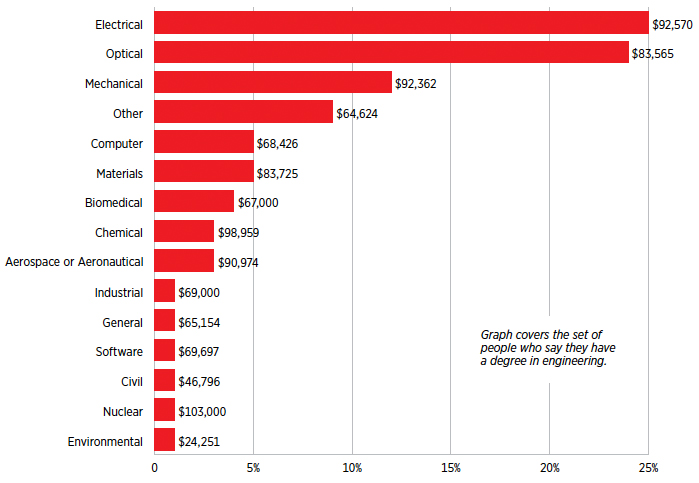
| • | The most popular engineering degrees are electrical (25%) and optical (24%), with mechanical (12%) falling in third place. |
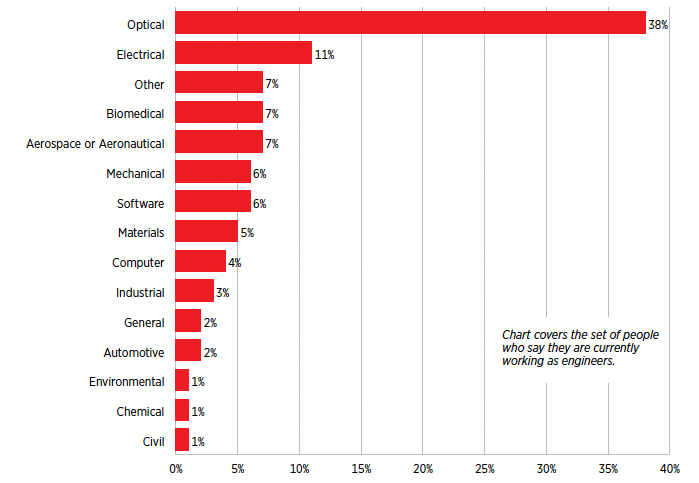
| • | The largest proportion of engineers focus their work on optical engineering (38%), followed by electrical (11%). |
| • | Startups account for just over 13% of workers at for-profit organizations. These workers earn median salaries of $83,565, versus $100,000 for those at traditional companies. |
| • | Almost two thirds of student respondents (64%) are working towards a PhD, followed by 22% pursuing master's degrees, and 12% seeking a bachelor's degree. |
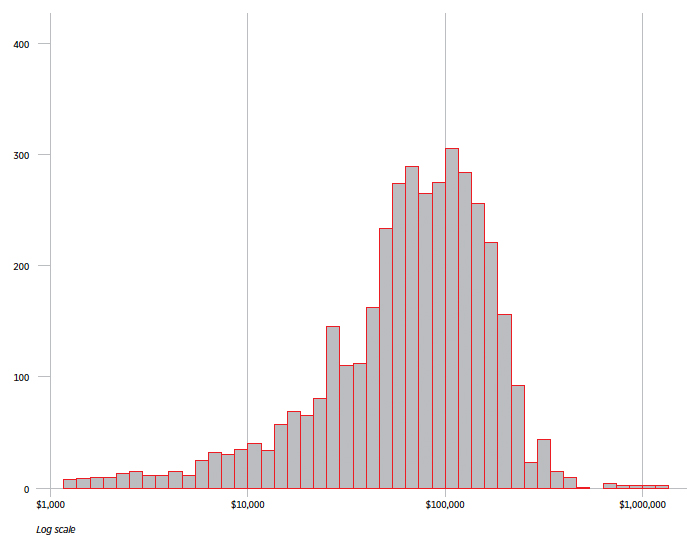
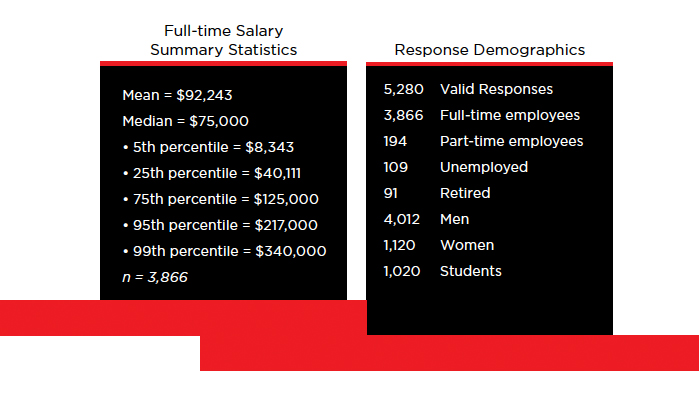
Full-time salaries cluster around the median of $75,000, with half of respondents being paid between $40,111 and $125,000. The overall distribution of pay is very wide, with 5th percentile workers earning $8,343 while those at the 95th percentile earn $217,000.
Distribution of Full-time Salaries
Most survey respondents were male, full-time workers. Women account for 21% of responses while 19% of participants were students. Small numbers of unemployed and retirees were represented.
Data Overview
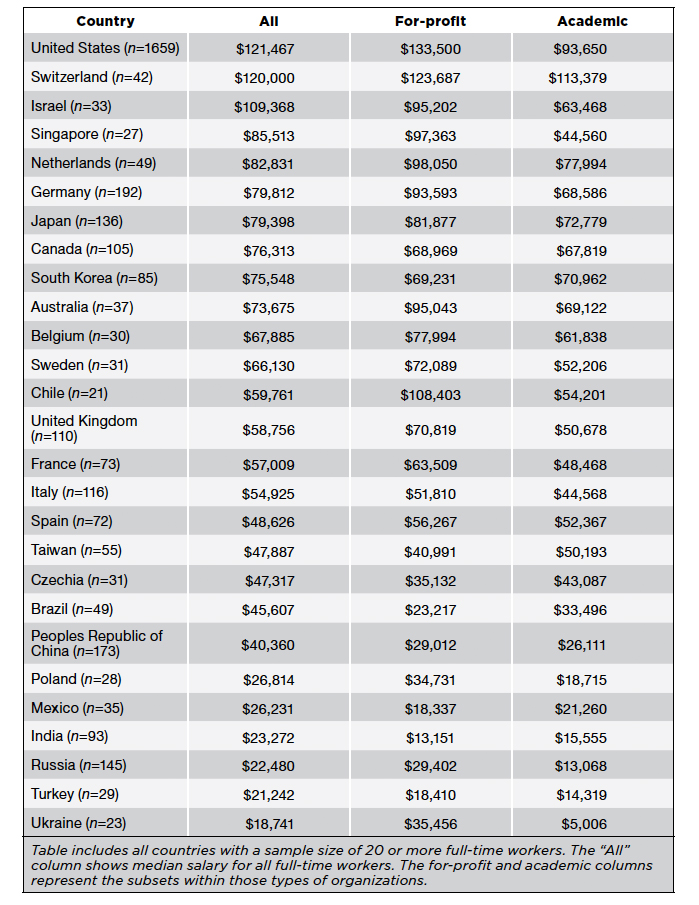
Workers in the United States, Switzerland, and Israel enjoy the highest median salaries. Within these high-earning countries, workers at for-profit organizations earn more than their colleagues in academia.
Median salary for full-time workers overall and at for-profit and academic employers
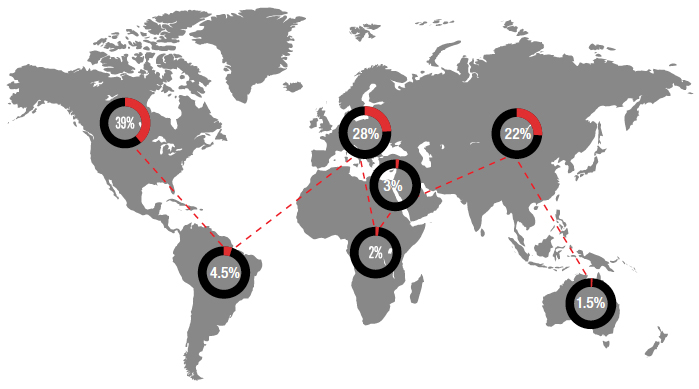
Survey Responses by Region
Engineers account for about two thirds of the optics and photonics workforce represented in the survey sample. Within this group, most have engineering degrees, while roughly one in seven work as engineers but do not have engineering degrees. Electrical engineering degrees are the most popular, followed closely by optical engineering. Combined, these disciplines account for about half of all the engineers in the sample. The small number of nuclear engineers enjoy the highest median wages.
65% of full-time workers identify themselves as engineers. Within this group:
"What type of engineering degree do you have?"
Median salaries shown
"What type of engineering is your main focus?"
Wages grew in both Asian currency groups, with Chinese yuan salaries increasing 33% and Japanese yen up 13%. Euro salaries rose 10%, and pay in US dollars was up 4%. Salaries paid in British pounds declined by 2%. Over the longer term, median salaries have increased in all five these currency groups, with pay in Chinese yuan increasing the most, rising 122% since 2011.3
Change in Median Salaries, 2011–2019, Main Currency Groups
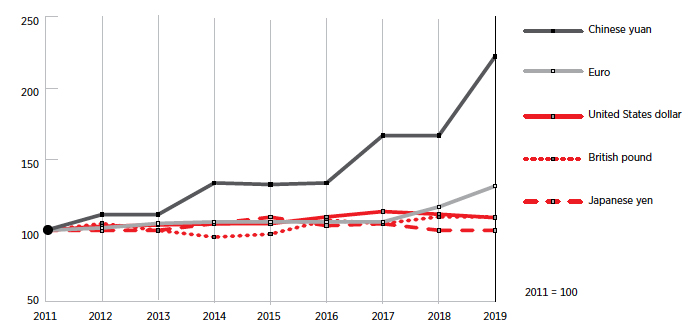
Growth in Median Salaries, 2011–2019, Main Currency Groups

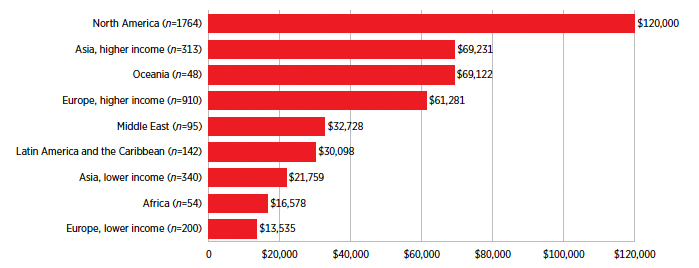
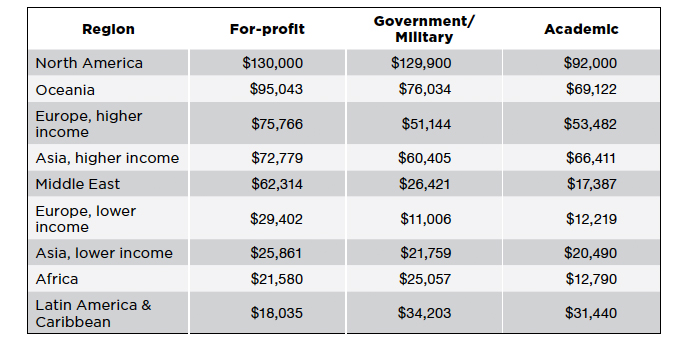
North America and higher-income Asia stand out as the regions with the highest salaries.4 A large portion of regional income gaps is explained by the level of economic development of countries within each area.5
Median Salary by Region
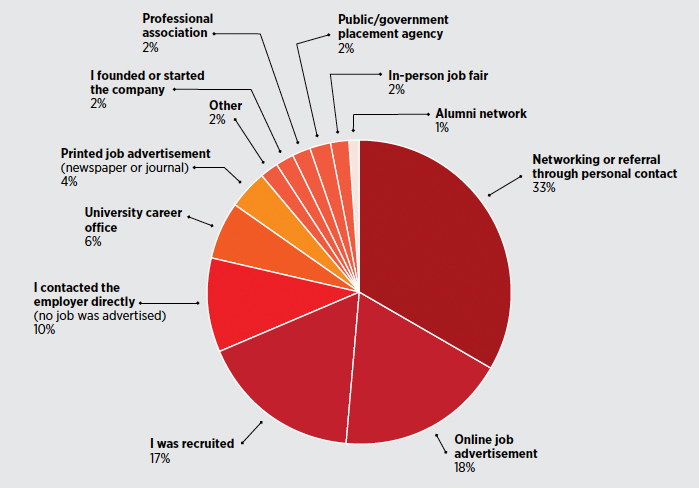
Job seekers cited networking as the number one way they found their current jobs.
“How did you find your original position at your present employer?”
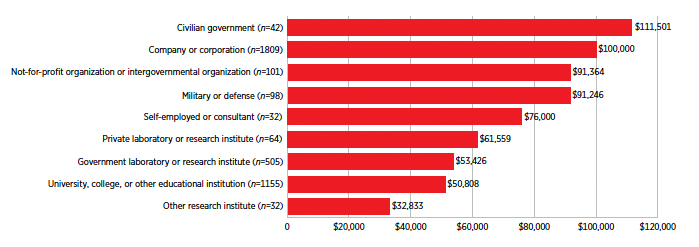
Median salaries are greatest in civilian government, followed by for-profit companies. Universities, colleges, and other research institutes pay the least.6
Median Salary by Employer Type
Median Salary by Region: For-profit, Government/Military, and Academic Employers
Startups account for just over 13% of workers at for-profit organizations. These entrepreneurs earn median salaries of $83,565, versus $100,000 for their colleagues at traditional companies.
Median Salaries at Startup versus Traditional Companies

Aerospace and semiconductor disciplines enjoy the highest median earnings, at $130,000 and $115,000, respectively. Remote sensing falls at the opposite end of the spectrum, with a median salary of $49,847.
Median Salary by Primary Discipline
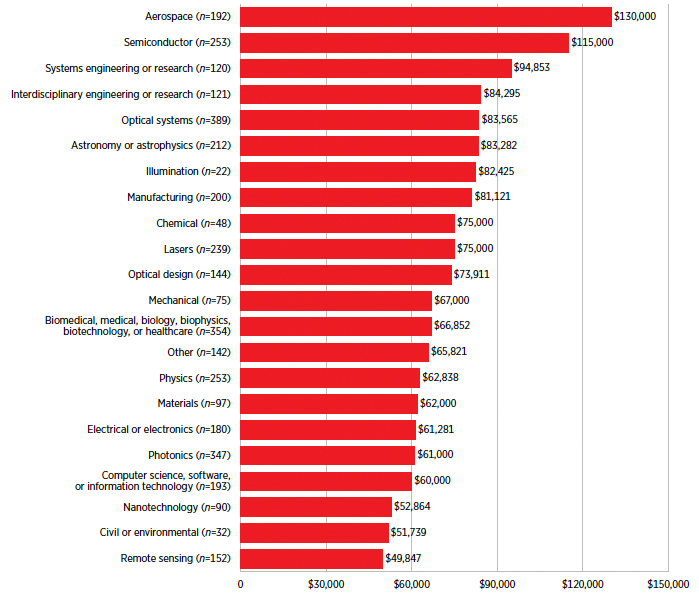
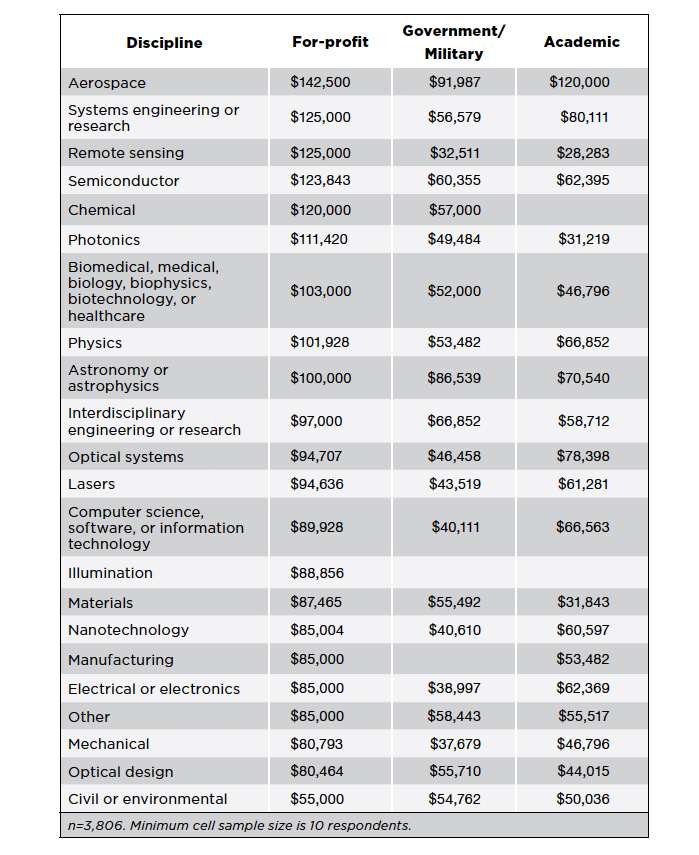
The two most important factors driving salary gaps across disciplines are employment sector and country income level. The highest-paying disciplines have much higher representation at for-profit companies: 88% of semiconductor and 66% or aerospace workers are at for-profits.
Country income level has a similar impact on median salaries of optics and photonics disciplines. In the highest-paid category, aerospace, 88% of workers are located in North America or higher-income European countries.
Median Salary by Discipline: For-profit, Government/Military, and Academic Employers
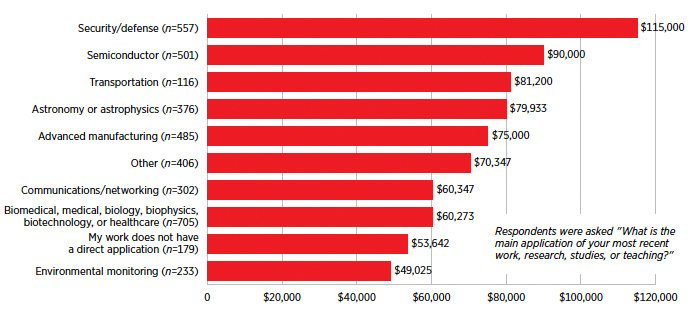
Security/defense is the highest-paid application area, which is unsurprising given that roughly half of these workers are in aerospace, the highest-paying discipline.
Median Salary by Application Area
Women make up 21% of the respondents to the survey, 33% of students, and 18% of full-time workers. Women earn less than men overall, with respective median salaries of $63,099 and $77,994.
Median Salary by Gender and Region
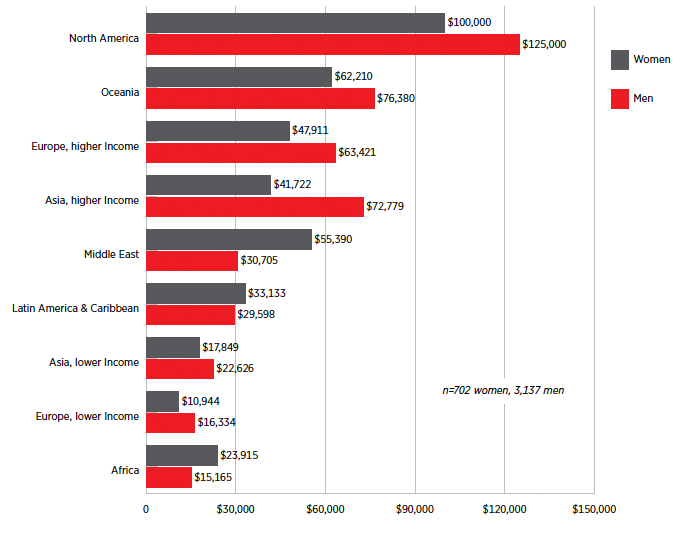
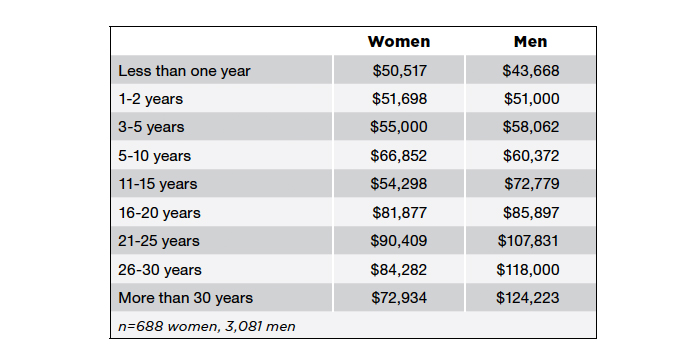
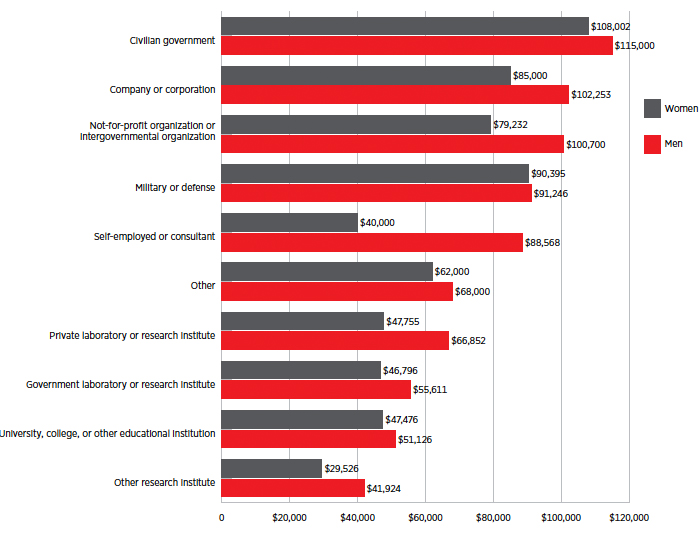
The largest wage differences are associated with higher-income Asian countries, self-employment, and employment of more than 30 years. Wage gaps for women persist in most demographic subsets of the data, though women earn more than men in a variety of subgroups: Africa, the Middle East, and Latin America and the Caribbean, and three out of four early career stages.
Median Salary by Gender and Years Employed
Median Salary by Gender and Employer Type
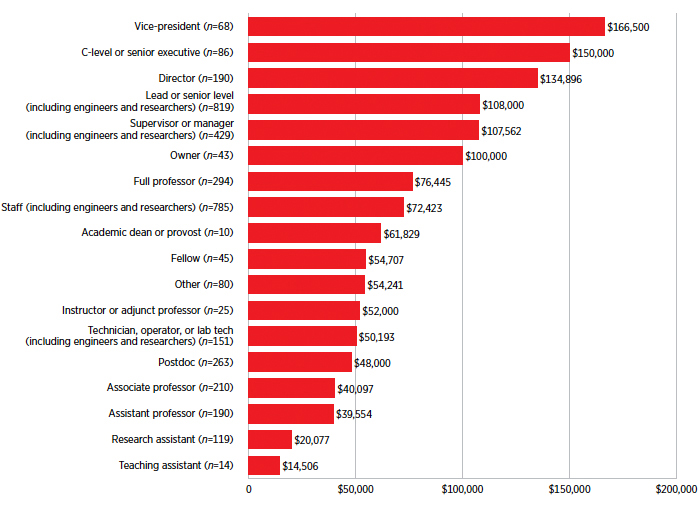
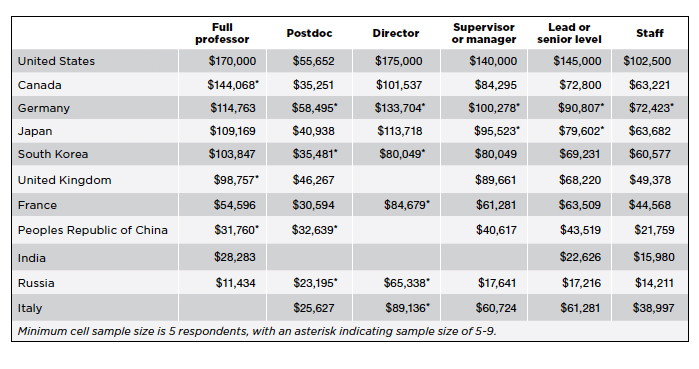
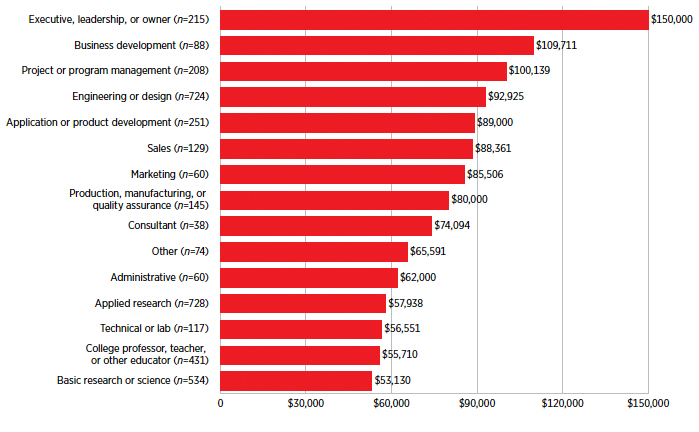
Other factors that influence salary include job level and job role. Top organizational leaders enjoy the highest salaries, while teaching assistants anchor the bottom of the range.
Median Salary by Job Level
Median Salary by Job Level, Selected Countries
Median Salary by Job Role
The majority of student respondents are pursuing PhDs.
Degree Being Pursued

In January of 2020, SPIE sent email survey invitations to a large subset of its global customer database. Response was voluntary and open. An iPad raffle and early access to this report were offered as incentives to encourage participation. Surveys were completed online using SurveyGizmo’s enterprise survey tool. Results were filtered for duplicates and invalid data to yield 5,280 valid responses. Microsoft Excel and SPSS were utilized for summary statistics and related analyses.
For questions, comments, or suggestions, contact report author Adam Resnick at adamr@spie.org.
This report was written in January 2020, before the COVID-19 situation reached international scale. Results reflect the reality of 2019 and will serve as a baseline for future research into the impact of this health crisis on our community in 2020 and beyond.
Notes:
| 1. | This list includes valid responses from full-time, part-time, unemployed, student, and retiree respondents. United States (1899), Peoples Republic of China (348), India (256), Germany (250), Russia (194), Japan (169), Canada (146), Italy (143), United Kingdom (140), South Korea (117), France (98), Mexico (88), Spain (84), Taiwan (79), Brazil (73), Australia (58), Netherlands (55), Switzerland (54), Turkey (48), Belgium (47), Sweden (43), Israel (42), Poland (39), Czechia (38), Ukraine (34), Pakistan (33), Singapore (31), Chile (28), Portugal (27), Finland and Indonesia (26), South Africa (24), Lithuania and Malaysia (23), Austria and Colombia (22), Algeria (20), Argentina and New Zealand (19), Egypt (18), Denmark and Romania (17), Thailand (16), Nigeria (15), Greece (14), Ireland (13), Hungary and Philippines (11), Bulgaria and Saudi Arabia (10), Hong Kong SAR, China, and Morocco (9), Tunisia (8), Latvia, Slovak Republic, United Arab Emirates, and Vietnam (7), Belarus and Jordan (6), Bangladesh, Estonia, and Norway (5), Armenia, Ecuador, and Kenya (4), Ethiopia, Ghana, Iraq, Peru, Qatar, and Tanzania (3), Bolivia, Chad, Croatia, Kazakhstan, Lebanon, Libya, Luxembourg, Macao SAR, China, Serbia, Slovenia, Sri Lanka, and Zambia (2), Botswana, Cameroon, Côte d’Ivoire, Cyprus, Georgia, Guatemala, Iran, Kuwait, Kyrgyz Republic, Liberia, Mongolia, Oman, Paraguay, Senegal, Tajikistan, Uruguay, and Venezuela (1). |
| 2. | US dollars are used throughout. Local currencies were converted using January 2020 market exchange rates. Salary figures include total yearly compensation, both base pay and bonuses. Full-time employees are those who indicated working 35 or more hours per week. Unless otherwise noted, all data on pay is drawn from full-time employees. |
| 3. | Yearly growth was computed by comparing same-currency results for each year. |
| 4. | Oceania is comprised of Australia and New Zealand. North America is comprised of the United States and Canada. Mexico is included in the Latin America and Caribbean category. |
| 5. | Europe and Asia are composed of countries spanning a wide range of income levels, even when subdivided into higher- and lower-income groups. For example, the European higher-income category includes Lithuania and Norway, at $17,430 and $80,610 per capita Gross National Income (GNI), respectively, for 2018. European lower-income countries include Russia at $10,230 and Ukraine at $2,660. Higher- and lower-income subcategories are based on the World Bank’s threshold for high-income countries, $12,376 per capita GNI in 2018. This threshold is used throughout this report when referring to “higher-income” and “lower-income” countries. For data on per capita GNI, see http://data.worldbank.org/indicator/NY.GNP.PCAP.CD/countries. For World Bank country income categories, see http://data.worldbank.org/about/country-classifications |
| 6. | The category “for-profit” is composed of company/corporation, self-employed/consultant, and open text “other” entries that indicate for-profit affiliation. “Academic” is composed of university/college, private lab or research institute, not-for-profit, intergovernmental, other research institute, and open text “other” entries that indicate academic organizations. “Government/military” is composed of government lab or research institute, civilian government, and military/defense. |
| Enjoy this article? Get similar news in your inbox |
|

