Monitoring Effects of Gushing Oil
Remote-sensing technologies and imaging systems are helping to monitor the environmental disaster in the Gulf of Mexico. With bonus Web content.
The most advanced remote-sensing technologies and imaging systems from across the globe were enlisted to track the volcanic ash cloud that disrupted air traffic in Europe this spring and to respond to the millions of gallons of oil threatening the ecosystem and economy around the Gulf of Mexico.
The U.S. National Oceanic and Atmospheric Administration (NOAA) has partnered with research organizations in the Gulf Coast area and throughout the world to track the movement of the oil and understand the leak’s impact on the environment.
"NOAA is using all the scientific methods at our disposal to assess the damage, from satellites in space, planes in the air, boats on the water, gliders under the sea, scientists in the field, and information online," said NOAA Administrator Jane Lubchenco.
NASA mobilized its remote-sensing assets in response to the disastrous Deepwater Horizon BP explosion and oil leak, deploying its instrumented research aircraft, the Earth Resources-2 (ER-2), and conducting extra satellite observations and data processing. The ER-2 collects detailed images of threatened coastal wetlands with the Airborne Visible/Infrared Imaging Spectrometer (AVIRIS) and the Cirrus Digital Camera System.
The AVIRIS team, led by Robert Green of NASA’s Jet Propulsion Laboratory, is measuring how the water absorbs and reflects light in order to map the location and concentration of oil, which separates into a widespread, thin sheen and smaller thick patches. Green is a frequent contributor at SPIE conferences and past chair of the Asia-Pacific Symposium on Remote Sensing of the Atmosphere, Environment, and Space. He is a co-author of five papers to be presented in August at SPIE Optics+Photonics on airborne imaging spectrometers and related topics.
NASA has also provided satellite images from the Moderate Resolution Imaging Spectroradiometer (MODIS) instruments on the Terra and Aqua satellites; the Japanese Advanced Spaceborne Thermal Emission and Reflection Radiometer (ASTER) on Terra; and the Advanced Land Imager (ALI) and Hyperion instruments on its Earth Observing-1 (EO-1) satellite.
Envisat’s Medium Resolution Imaging Spectrometer (MERIS) and Advanced Synthetic Aperture Radar (ASAR) operated by the European Space Agency, as well as WorldView-2 (USA), TerraSAR-X (Germany), RADARSAT-2 (Canada), and other instruments have also been tasked to monitor the catastrophe through the International Charter Space and Major Disasters.
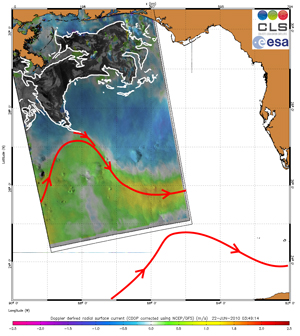 Bertrand Chapron of Ifremer, the French Research Institute for Exploitation of the Sea, and Fabrice Collard of France's CLS, have been combining surface roughness and current flow information with Envisat's ASAR data to monitor the oil spill, according to the ESA. The radar image acquired on 22 June 2010 shows that the oil spill (outlined in white) has radiated all over the Gulf of Mexico basin and is continuing to feed into the Loop Current (red arrow).
"This is a new piece of evidence of the seemingly strong attracting power of the intense Loop Current in this area," Chapron said. "Based on the striking analogy between different observations, we can confirm that part of the spill is more or less continuously trapped with this intense current which will radiate the pollution over the southern part of the Gulf."
By performing dedicated processing methods on the images to display surface features like variations in roughness and velocity, observations now provide insight into the spatial structure of the spill and its transport by surface currents.
On 18 May, a long tendril of the oil spill was detected extending down into the Loop Current. "Using surface current analysis from ASAR data, we have identified a progressive cutoff in the Loop Current evolving into a large eddy separated from the main stream," Collard said. "If confirmed in the days to come, this would mean that part of the oil spill is still attracted by the strong cutoff eddy generated by the Loop Current (as observed in the 22 June image), but still remain contained within the Gulf of Mexico."
From below the water, too, optics and photonics technologies are used to estimate the rate of the oil leaking into the water and to remotely operate underwater vehicles and imaging systems.
 Scientists at the University of South Florida College of Marine Science assumed a high-profile role in tracking the leak early on. Located in a St. Petersburg building adjacent to a U.S. Coast Guard command center, USF oceanographers have studied Gulf currents for decades and were ideally situated to respond quickly after the April 20 explosion that killed 11.
Among USF’s contributions was its sophisticated underwater imaging system, SIPPER (Shadowed Image Particle Profiling Evaluation Recorder). The SIPPER’s linescan camera can image 14 liters of water per second at 3 knots towing speed and will assess whether microscopic sea life has been damaged by the oil.
Scientists aboard the USF research vessel Weatherbird II reported in late May, and NOAA's independent analysis confirmed in June, the presence of very low concentrations of sub-surface oil and polycyclic aromatic hydrocarbons (PAHs) at sampling depths ranging from 50 meters to 1400 meters. Detectable levels of petroleum compounds had traveled as far as 42 miles northeast of the leaking well.
"The questions we are exploring are where is it, in what concentrations, where is it going, and what are the consequences for the health of the marine environment?" Lubchenco said. NOAA's report from the Weatherbird II sampling is available online as a PDF.
About a dozen faculty members and 18 grad students from USF have participated in oil spill research, according to a USF spokeswoman. Among them are Ernst Peebles, an associate professor of biological oceanography. Peebles noted in a Miami Herald interview that USF was among the first to research the origin of tar balls 40 years ago. Most people assumed the oil industry was responsible, but USF showed they came primarily from ships illegally discharging crankcase oil. That led to stricter regulations in the shipping industry.
Researchers at the University of Texas at Austin’s Texas Advanced Computing Center are using the Ranger supercomputer to produce 3D simulations of the impact of the oil spill on coastal areas, and scientists at the Center for Southeastern Tropical Advanced Remote Sensing (CSTARS) at the University of Miami are also collaborating by acquiring critical environmental imagery to model possible oil trajectories.