Optical instruments aboard GOES-16 weather satellite
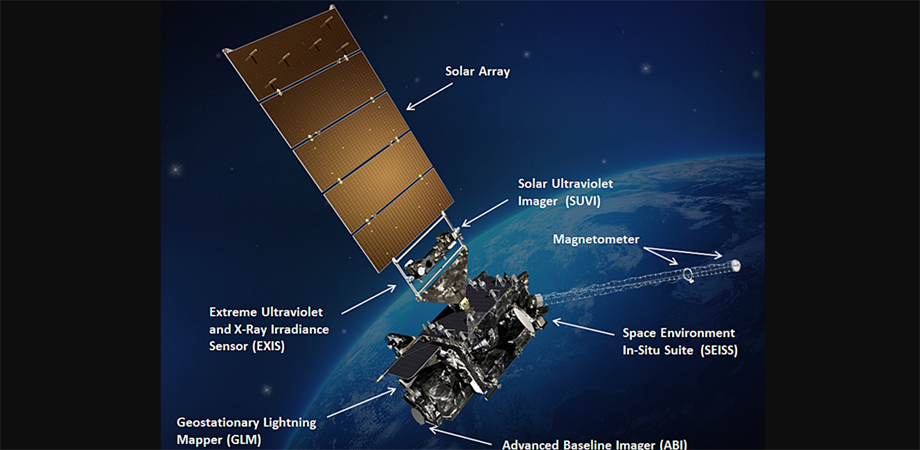
GOES-16 is the newest NOAA-NASA weather satellite in geostationary orbit and will provide high-definition images and other data for weather forecasting, severe storm tracking, and meteorology research.
The NOAA-NASA fleet of Geostationary Operational Environmental Satellites (GOES) has delivered continuous imagery and data on atmospheric conditions and solar activity since 1975. GOES-16, the most recent one to be launched in orbit and the first of the GOES-R series, represents the first major technology advancement for meteorological, solar, and space research in more than 20 years.
Launched in November 2016 and currently undergoing a testing and validation phase before being declared operational by the end of 2017, GOES-16 is already providing extraordinary new views of solar flares and weather conditions on Earth. The fine detail of the imagery and the fast refresh time of the preliminary data are helping meteorologists better understand storms as they unfold with second-by-second, near-real time sequences.
From a fixed location over the Earth's western hemisphere, three optical instruments aboard GOES-16 provide a half terabyte of images and other data to Earth every day, helping perform weather forecasting, severe storm tracking, and meteorology research.
The increased spatial resolution and faster coverage of these instruments allow more accurate meteorological forecasts, real-time mapping of lightning activity, and improved space weather and solar activity monitoring for better warnings about disruptions to power grids, communications, and navigation systems.
 instrument")
This composite color full-disk visible image is from 1:07 p.m. EDT on January 15, 2017 and was created using several of the 16 spectral channels available on the GOES-16 Advanced Baseline Imager (ABI) instrument. The image shows North and South America and the surrounding oceans. Credits: NOAA/NASA
The advanced baseline imager (ABI), built by the same group at Harris Corp. that built the imagers on currently deployed GOES, is the main instrument used for monitoring the Earth's weather and environment. It is like a high-resolution digital camera with 7000 detectors that monitors 16 spectral bands across two visible, four near-infrared (NIR), and 10 IR channels.
The optics aboard provide image resolution of one-tenth of a square mile, a four-times-better spatial resolution than prior GOES. Weather service offices can create multi-composite images, take differences, and combine the bands to help improve storm predictions and ‘now-casting.'
Its additional spectral bands offer new products (data sets) to detect aerosols, smoke, dust, properties of clouds, hot spots from fires, sea surface temperatures, and total water vapor. It offers 34 data products and 31 more that could be used in the future.

The GOES-R ABI Sensor Unit. Credits: NOAA/NASA
Compared to current GOES imagers using a single water vapor band showing jet streaks, the ABI has three bands that do a better job detecting steering winds for hurricane forecasts and intensity tracking.
The imager can also detect the presence of sulfur dioxide in volcanic ash, which is important for aviation safety. Combined with better spatial resolution, it is able to detect small fires and estimate their intensity.
"Now that volcanic ash clouds can show up on satellite, pilots can plan routes to avoid them sooner, without waiting to smell something while they're flying," says Tim Schmit, research satellite meteorologist at NOAA's Advanced Satellite Products branch. "There will be fewer weather-related flight delays and airline incidences with volcanic plumes.
"Data will not only help direct users, like forecasters, hurricane centers, model-makers, and researchers, but indirect users on mobile phones. Everyone using apps based on NOAA models will use this data," Schmit says.

The GOES-R GLM Sensor Unit Prior to Thermal Vacuum Testing. Credits: NOAA/NASA
Another optical instrument, the geostationary lightning mapper (GLM) is the first operational lightning mapper in geostationary orbit. Compared to the ABI sampling 16 spectral bands on thousands of detectors, the GLM samples individual pixels very quickly at a single near-infrared band from its 1-megapixel detector array. It is considered an event detector rather than an imager.
To map lightning, the GLM processes individual pixel data from a high-speed 1372- x 1300-pixel charge coupled device (CCD) focal plane, taking samples with a wide field-of-view lens and narrow-band interference filter. Images go through spectral, spatial, and temporal filters and background subtraction from each pixel to determine if a lightning flash is present. Its 56 real-time parallel event processors quickly integrate background earth and cloud images to detect the transients of light and call them lightning.
Steven Goodman, chief program scientist for the GOES-R series at NOAA, says, "It's easy to detect transient lightning flashes at night, and the system is almost 100% efficient doing so. But, during the day when the clouds are lit by sunshine, it's challenging." So scientists use the narrow 777.4nm NIR-singly ionized oxygen triplet and have to minimize the noise of any background sunlight reflecting off cloud tops, he says.
Each pixel in the GLM can cover 8 km of cloud top because of its good signal-to-noise ratio when looking down at puddles of light on cloud tops from orbit. "Completely filling the pixel gives a better S/N ratio," Goodman says. He adds that using 1km pixels (each pixel covering 1 km) would split the energy, "so it wouldn't be strong enough in any given pixel to trigger detection."
While GLM does a good job detecting total light, since it is a space-based technique, it cannot determine if a flash is a cloud or ground flash. Current ground-based networks see cloud-to-ground lightning strikes by their characteristic radio frequency and other non-optical signatures. But they are subject to ambient noise and propagation and performance variations over a given time period.
Detecting total lightning is key for predicting the likelihood of a strike on the ground. It includes the in-cloud activity that is dominant when a storm is getting stronger, and seeing how the total activity changes over time provides information about how storms develop.
 lightning data")
This is one hour of GOES-16's Geostationary Lightning Mapper (GLM) lightning data from Feb. 14, when GLM acquired 1.8 million images of the Earth. It is displayed over GOES-16 ABI full disk Band 2 imagery. Brighter colors indicate more lightning energy was recorded; color bar units are the calculated kilowatt-hours of total optical emissions from lightning. The brightest storm system is located over the Gulf Coast of Texas, the same storm system in the accompanying video. This is preliminary, non-operational data. Credits: NOAA/NASA
Forecasters are excited about the GLM so they can combine both space and ground techniques since each offers different information needed for decision making. High-resolution imagery of lightning dancing around on cloud tops will be overlaid on ABI images for public safety benefits. "With better information on TV, smart phones, and in mobile apps, people can see lightning coming, personalize the risk, and take cover," Goodman says.
New real-time warning applications will serve people working or playing outdoors, showing how far the lightning extends and where it is propagating. Very useful for airport workers on the tarmac, these will provide information about lightning in distant clouds that can't be seen on the ground because it hasn't yet made a strike.
For planes flying routes over oceans, mapping the GLM onto ABM imagery makes it possible to see where storms are developing much farther than radar, which can't see over the horizon. "Like a poor man's radar, GLM will become part of the standard information for SIGMET (significant meteorological information) alerts for dispatchers and pilots to check where significant weather is," Goodman says.
Over the last two decades, trends in solar physics for imaging the sun's corona moved away from using xrays and towards narrow band extreme UV. EUV images help scientists more easily isolate the exact temperature of solar features to know whether solar flares or cooler layers of the sun's atmosphere are present.

The SUVI Installed on GOES-R Satellite. Credits: NOAA/NASA
The solar ultraviolet imager (SUVI) is the third optical instrument aboard GOES-16. It is an EUV telescope built by prime contractor Lockheed Martin with specialized expertise from many innovation centers. It will monitor and study the corona's plasma where temperatures range from 50,000K up to 10,000,000K.
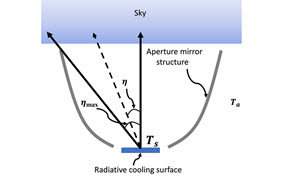
To understand the structure of the sun's corona, SUVI uses multi-layer coated mirrors reflecting light at normal incidence, an update over older technologies that use grazing incidence mirrors, which require more complex engineering and larger telescopes. The multilayer mirrors isolate observations to narrow wavelength ranges, helping create better forecasts and alerts and more accurate models. These are important for GPS users, power grid, and satellite managers whose system performance can be impacted by strong electric currents and energetic particles that come from space.

These images of the sun were captured at the same time on January 29, 2017 by the six channels on the SUVI instrument on board GOES-16 and show a large coronal hole in the sun's southern hemisphere. Each channel observes the sun at a different wavelength, allowing scientists to detect a wide range of solar phenomena important for space weather forecasting. Credits: NOAA
"We are in a new realm, learning how to use this data to produce more accurate forecasts," says Jonathan Darnel, SUVI instrument manager at NOAA's National Centers for Environmental Information.
Knowing whether extreme space weather events are coming is important to GPS users in aviation and other major systems such as high-altitude aircraft. Power grid managers could disconnect their networks.
Satellites could go into safe mode. And knowing whether a military system encountered an adversary or a space weather event, the response could be different.
"It is important the instrument is so robust there are no failures or data interruptions. So nothing experimental goes into a spacecraft that pushes the boundaries," Darnel says. "Upcoming versions will have better optics, novel filter combinations, and CMOS image sensors, which haven't been tested in high-resolution imagers in orbit yet."
The testing and calibration of the satellite's instruments, validation of data, and engineering checkout of the ground communication systems that generate real-time data products and make the products available to users, is expected to be completed by November or December at which time GOES-16 will be declared operational.
Around the same time, GOES-16 will move from 89.5 degrees west longitude, 22,300 miles over the Equator, to 75 degrees west longitude to replace GOES-13 over the Atlantic Ocean.

This 16-panel image shows the continental United States in the two visible, four near-infrared and 10 infrared channels on ABI. These channels help forecasters distinguish between differences in the atmosphere like clouds, water vapor, smoke, ice and volcanic ash. GOES-16 has three-times more spectral channels than earlier generations of GOES satellites. Credits: NOAA/NASA
From its perch, GOES-16 will be able to observe the entire continental United States and "monitor areas most vulnerable to tornadoes, floods, land-falling tropical storms, hurricanes, and other severe storms," says Stephen Volz, director of NOAA's Satellite and Information Service.
Although the US satellite's sensors and imagers are trained on the western hemisphere, the data will help improve forecasts over Europe as well because weather information "upstream" is used to better stretch out the forecast length, Goodman says.
The next satellite in the fleet, GOES-S, will launch in early 2018 and replace GOES-15 over the Pacific Ocean. GOES-T and GOES-U will be launched in 2020 and 2024, respectively, to extend the operational GOES series satellites through 2036.
Debbie Sniderman is CEO of VI Ventures LLC, an engineering consulting firm.
At least six presentations related to GOES-16 will be presented at SPIE Optics + Photonics 2017, 6 -10 August in San Diego, CA, USA.
- Calibration/validation status for GOES-16 products, Paper 10402-29
- Site selection and characterization at Uyuni desert for the calibration and validation of GOES solar reflective bands, Paper 10402-94,
- MTF analysis using lunar observations for Himawari-8/AHI, Paper 10402-90
| Enjoy this article? Get similar news in your inbox |
|