Finite-sized water vapor clouds affect interferometry phase corrections
The effects of atmospheric water vapor are the most serious problem facing astronomical observations on ground-based interferometric millimeter-wavelength arrays because the associated turbulence distorts wavefronts and decreases phase coherence.1 Current approaches for correcting the phase and recovering the coherence use atmospheric path delays for each array antenna estimated from water vapor detection.2 However, the results from the many studies that have been conducted, or are ongoing,3–7 show that the water vapor phase correction is not as effective as expected. Based on numerical simulations, we have found that this is due at least in part to the effects of finite-sized water vapor clouds.
Phase coherence between antennas plays a key role in observational data quality for interferometry. For example, array-processed signals generally weaken as phase noise increases: Figure 1 shows simulated normalized power of noise-degraded waves plotted against RMS noise amplitude for two noise distributions. This is a crucial problem when trying to detect small signals, such as those from large molecules. Figure 2 shows how detection sensitivity can improve by halving the phase noise, demonstrating the benefits of mitigating this problem.


Water vapor radiometers (WVRs) are used to collect phase correction data. They are designed to detect atmospheric water vapor at the 22GHz or 183GHz lines,3,4,6 or in the continuum band from 210 to 250GHz.5,7 The use of data from these instruments assumes that water vapor clouds are large enough—i.e., not finite in size—that antenna temperature scales with water vapor brightness temperature. However, in light of the many inconsistent WVR results, this assumption must be carefully reconsidered. We present here numerical modelling results showing that detection efficiency significantly depends on water-vapor cloud heights and sizes.8
Since water vapor exists in both the near- and far-field regions of the array, determining the effects of different-sized water vapor clouds along the line of sight must be established by understanding antenna patterns. We numerically model microwave propagation and generate one-dimensional antenna patterns in Cartesian coordinates measured along the line of sight, and perpendicular to the antenna axis. Only the water vapor along the line of sight affects the path delay of the millimeter signal. Assuming a 10m dish and a 1cm wavelength, Figure 3 shows the patterns at distances of 200m, 2km, 20km, and 40km. The near-field pattern at 200m—the Fresnel pattern—is clearly obtained, and those at 20km and 40km are typical for the far-field. The 2km pattern is narrow, as measured by its full-width half-maximum point.

Using these patterns, we calculated the detection efficiency for water vapor layers as the ratio of the antenna and cloud brightness temperatures. As can be seen in Figure 4, the efficiency obviously depends on a cloud's size and height, such that smaller or higher ones correspond to lower detection efficiency. In particular, a 10m cloud at a modest 2km height yields an antenna temperature that is only 90% of the brightness temperature, implying the need for atmospheric turbulence models to improve path delay estimates that are based on water-vapor detection.

Interferometry is a very-high-precision technology. At millimeter and sub-millimeter wavelengths, the path-delay variation that must be corrected is only a few hundreds of microns. The sensitivity of the 22GHz WVRs will require a few tens of milliKelvin (noise equivalent temperature difference), and the phase correction is required within seconds to recover the variation. On such short time scales, knowledge of the atmospheric turbulence is critical to the WVR application. Our simulations shows that the instrument's sensitivity can be undermined by water vapor clouds spanning a range of sizes. The simple scale factor for deriving the path delay from 22GHz WVR systems is hardly enough to get satisfactory results. This shows that we need to understand more about atmospheric turbulence and establish appropriate models9 for the derivation before the WVRs can work reliably.
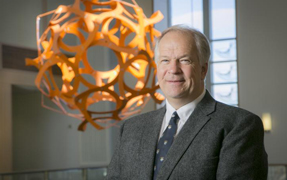
Y.-S. Jerry Shiao is a graduate student in the Department of Astronomy at the University of Illinois at Urbana-Champaign. His research interests include large-molecule detection and radio-telescope instrumentation.